
A formal process for flying a test mission and validating the accuracy and performance of your Discovery 2 drone after each flight.
On Landing Check All Files Present
The following items should be present after each flight - make it a habit to check for all of these files before leaving the field. Missing files can occur when we don't give the drone a full 2-3 minutes after power on, and can also be bugs or corrupted missions that need to be reported to SmartDrone.
- Collect data and confirm all file types are present after each mission. Desired files are:
- Folder with date and time label matching drone time zone
- Folders Present: Images, Raw, Logs
- File Present: Processor.exe
- Raw Contents:
- .boresight file
- .meta file
- Two .dat files LiDAR and lidar_dual
- .t04 file
- Logs Contents
- A and B log
- Images
- Multiple Photos and camera.json text file
Test Field or Project Validation Procedures
- Setup base station on known OPUS position.
- Take 15-30 check shots throughout the test field and export them as a text file.
-
- Discovery 2 LiDAR/RGB - perform mission collecting images and LiDAR for quality comparison
- Discovery 2 LiDAR ONLY - perform mission with photos turned off by increasing photo spacing to 999Plane drone flight over your Accuracy Field - perform 2-3 missions over the same area.
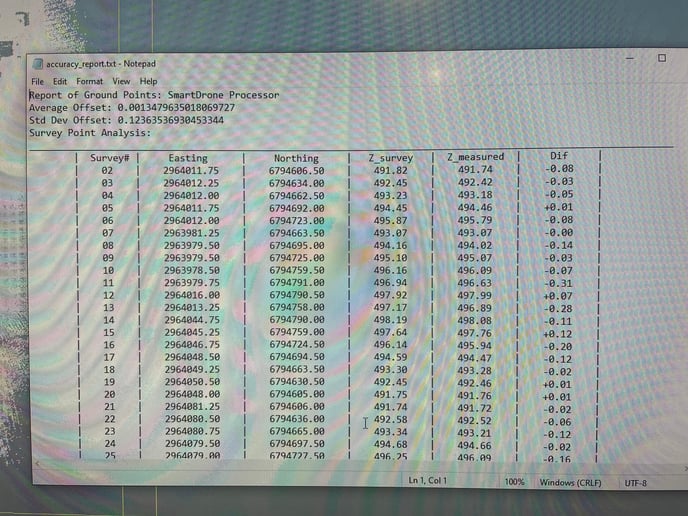
Processing Data and Evaluating GNSS Reports
We compare data against check shots to confirm elevations and ensure we are controlling for any drone performance issues, such as vegetation which may be difficult to penetrate. In addition, we review GNSS satellite connection and noise reports to ensure the internal positioning systems are functioning.
- Process the data with your check shots and base file
- Accuracy report desired values:
- Average offset < .2’
- Std deviation < .25’
- GNSS report desired values:
- Page 4, L1 Satellite Lock/Elevation, look for no breaks in the lines - in particular finding breaks across multiple lines that happen vertically together
.jpg?width=688&height=516&name=image%20(1).jpg)
- Page 4, L1 Satellite Lock/Elevation, look for no breaks in the lines - in particular finding breaks across multiple lines that happen vertically together
- Page 5, L1 SNR, don’t want any dips below 30 in the left hand bar
- Usually you see values as high as 45-50 at the peaks
- Don’t want to see big dips that last below 30 for all lines - a single random line dipping may not be critical
.jpg?width=688&height=516&name=image%20(2).jpg)